ABOUT THIS CONTENT
Supply and demand economics can be used to identify the market equilibrium.Table of Contents
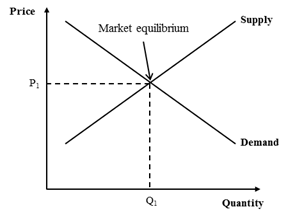
Supply and demand economics can be used to identify the market equilibrium. The demand curve is a depiction of price plotted against the quantity (volume) sold at that price for a given product. The supply curve presents the quantity of goods supplied at each price.
Demand Curve Shifts
Shifts in the demand curve can have many possible causes.
Possible causes for increase in demand
- Increase in product value/quality
- Price of substitutes rises
- Shift in consumer preferences
- Increase in disposable income of consumers
- Decrease in price of complementary products
- Trends (economic, social, cultural, marketing variables, etc.)
Possible causes of a decrease in demand
- Decrease in product value/quality
- Increase in value/quality of substitute products
- Increase in price of complementary products
- Trends (economic, social, cultural)
Supply Curve Shifts
Shifts in the supply curve can be caused by changes in the following factors.
- Technology
- Input costs
- Government regulation
An improvement in technology will shift the supply curve to the right because producers will be able to supply a greater quantity profitably at each price.
A reduction in input prices (lower wages, lower fuel costs, etc.) will induce companies to supply more output at each price, shifting the supply curve to the right.
Government regulations can sometimes be viewed as imposing a technological change that adversely affects producers. The effect of this regulation would be to shift the supply curve to the left, reducing the quantity produced at each price.
Methodology
- Construct the demand curve. Forecast demand by segment at various price levels. Determine the factors that shape the demand curve. Calculate the elasticity of demand and how it varies along different parts of the curve.
- Construct the supply curve. Identify units of capacity and order them from lowest to highest cost producers. Determine the factors that shape the supply curve. Calculate the elasticity of supply and how it varies along different parts of the curve.
- Determine the industry impact of supply/demand interaction. Determine how the industry dynamics operate: scale, scope, and learning. Determine the most important measure of cost to industry producers: marginal cost, long-run total cost, non-sunk cost.
Notes
- When a curve shifts, the new shape might be different from the original one
- In monopolistic or oligopolistic markets, the company’s strategies have an impact on market structures and the demand curve, which makes the analysis more complex. The market must be clearly defined or the wrong supplier may contribute to the curve
- Capacity at a plant can be allocated to several different product groups meeting very different needs
Strengths
- Helps to identify value and to depict it graphically
- Useful in understanding industry dynamics; even if used in a rough manner
Weaknesses
- Difficult to get data on supply and demand, which often results in having to obtain estimates from experts or historical data (which might no longer be valid)
- More difficult to use with products that have perceptual needs
- Primarily a static description
- Assumes that many of the factors are constant whereas in “real life” they might be constantly changing
- More effective for commodity products
Click to Add the First »